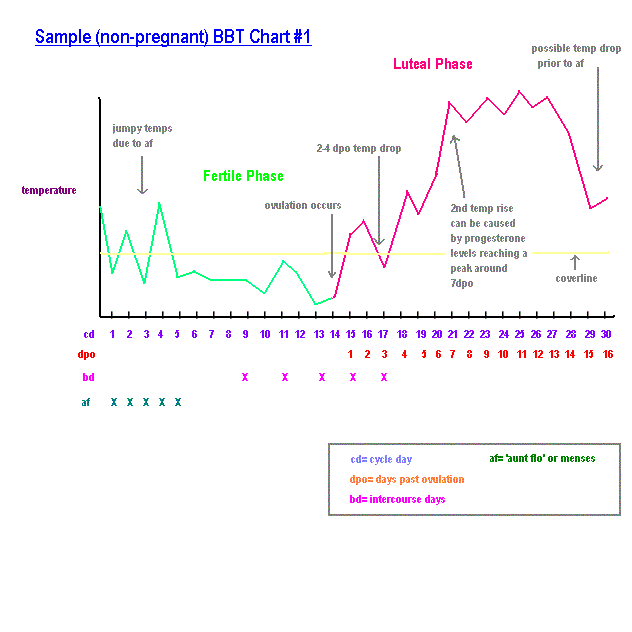

In Sample BBT Chart #1, the temperatures are slighly jumpy during the first few days due to menses. There is a slight drop in the temps prior to ovulation, a second drop in temps just after ovulation occurs, and a second rise in the temps as the progesterone peaks. Not all women experience these type of temperature fluctuations. However, this chart illustrates several possible normal temperature fluctuations that might occur during a cycle. |
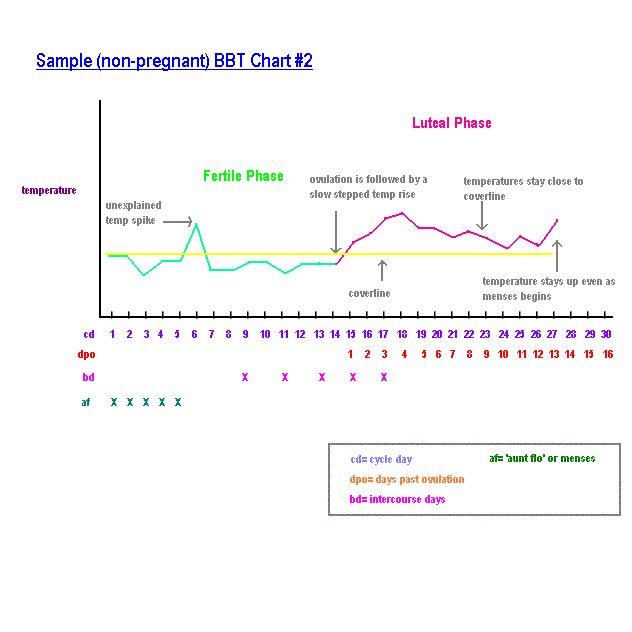
In Sample BBT Chart #2, the temperatures prior to ovulation are fairly consistent, with the exception of one temperature which is higher than the others. Since this temperature can't be explained and doesn't fit the pattern, it is not used when considering the overall pattern of the chart. After ovulation occurs, the temperatures take several days to rise, making a 'slow rise' pattern. The luteal phase temperatures stay slightly above the coverline, but do not dip below the coverline. The temperatures do not drop until after menses and a new cycle begins. Like Sample BBT Chart #1, this chart also shows a normal temperature pattern, although it is completely different from the first example given. |